
How the Canary
System works
Canary makes it easy to capture every data point, give it meaning with context, then surface insights your team can actually act on.
Collect & Store
Your Data
Collect data from all of your devices and store it with loss-less compression.

Apply Context to
Your Data
Transform your complex data into clear, easy to understand information.
Maximize Your
Operation
Analyze your operational health on any device and make better decisions.
The Fundamental Principles
We believe these values are essential for your success.

Secure
Data integrity matters. So does following IT best practices.

Open
Data flows without restriction. Break free from platform lock.

Adaptable
Edge. Site. Enterprise. Cloud. Canary seamlessly connects your organization.
Collect & Store
Your Data
Most operations have massive amounts of data. How you collect and store that data is vitally important to your success.
Data Collectors That Work
And no licensing restrictions to hold back your best work.


Trusted by industrial teams


Store & Forward Technology
Offline servers and broken networks won't mean your data is lost. Your data will write to the local disk if the historian is unavailable and automatically backfill once the connection is reestablished.

Canary Historian
At the center of the Canary System is the Canary Historian, a NoSQL proprietary time series database that is simply better than the competition.

Log Millions of Tags
✦As your operations expands, so does the Canary Solution. A single historian supports extensive tag counts.
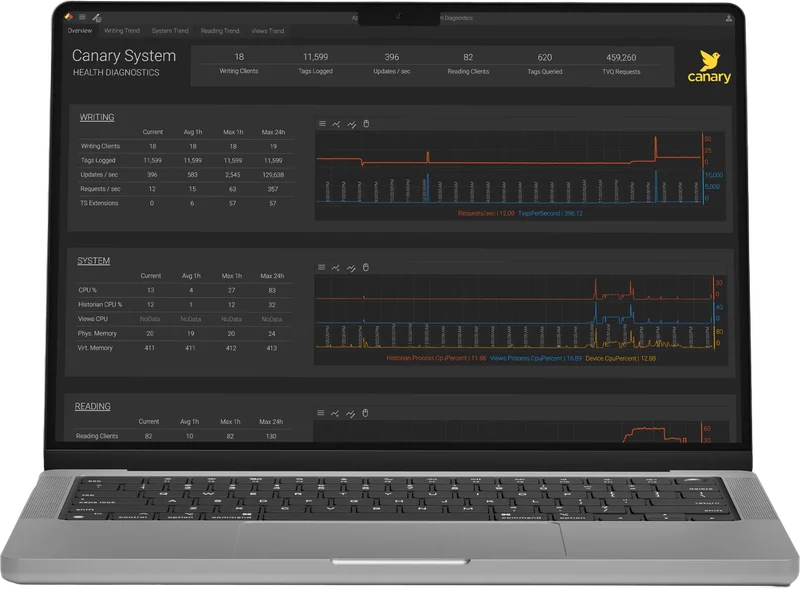
Loss-less Compression
✦Specifically built and optimized for high-speed performance without requiring data interpolation.
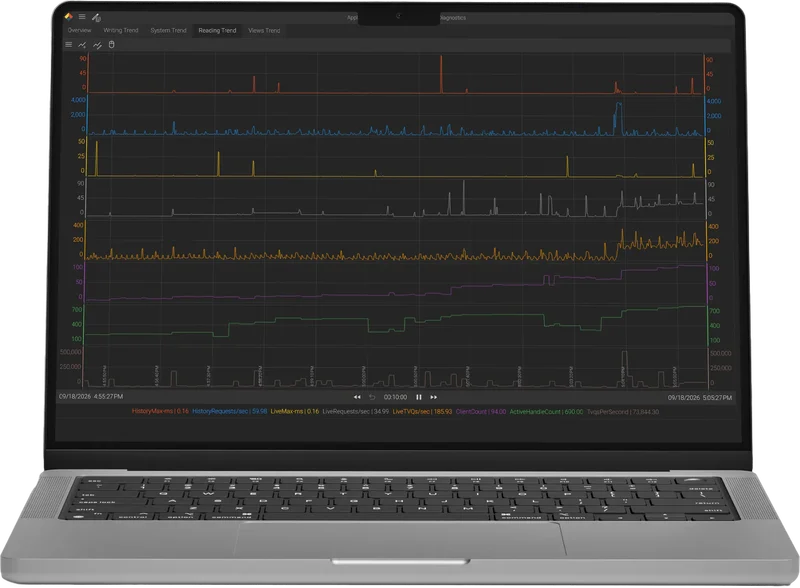
Incredibly Fast Performance
✦Designed for high-throughput environments, delivering unmatched write and read speeds.
Canary VS SQL
Canary SQLNo database management required

Provide loss-less compression
Performance unaffected by database size
No additional database licensing costs
Full Canary Historian Specs
We'll send it straight to your email inbox for you to review.
We only use this to send your report.

Apply Context to Your Data
Without context, data is overwhelming. With context, data is power. Canary is built to turn data into actionable information from day one.

Make virtual data models of the Historian with Virtual Views. Easily organize your tags into asset models, and adjust the tag naming structure. Views are the hub of all your data — every Canary service and third-party application that needs data from the Historian uses Views.


Asset Modeling
With Canary, you model data post-archiving, creating license-free and risk-free models based on how your team needs to consume information.

Calcs Server
Use tags already stored in the Historian to create new calculated tags, backfill included, without wasting time in SCADA or PLC.

Events
Create rules to monitor condition-based asset events, writing event and statistical data to a SQL database.

Maximize Your Operation
Visualize Data with Axiom
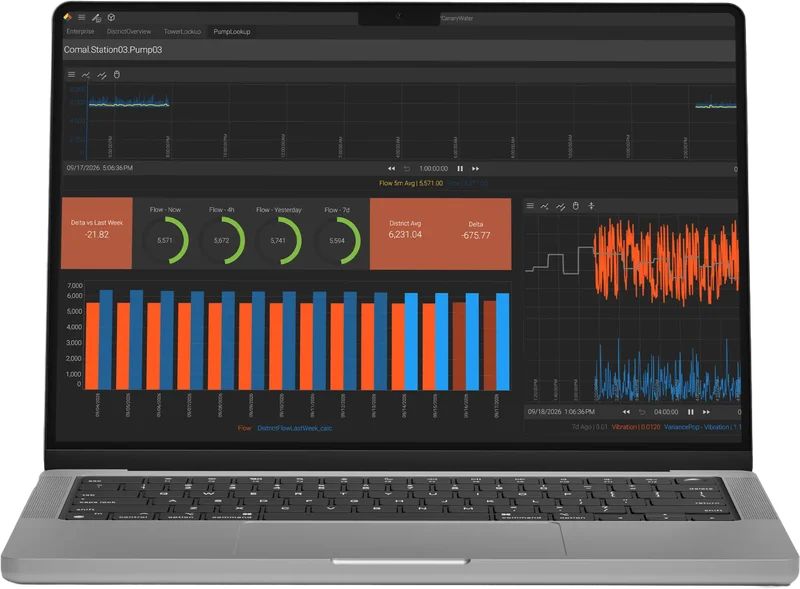
Deliver your data in a way that makes sense with Axiom, Canary's visualization tool. Build dashboards, charts, meters, trends, reports, and much more.
Try Axiom Now
We'll send an invite to your email for an Axiom Sandbox Demo.
See Axiom for yourself


Data Feeds
Connect your Canary databases to BI tools, SCADA systems, maintenance systems, cloud providers and data lakes, advanced reporting and analytics, and machine learning applications. Real-time updates via MQTT Sparkplug, JSON over WebSocket, or GRPC and Web API. Historical data requests via the Excel add-in, Axiom, or ODBC.
Talk to us
Any Questions?
Ask us anything you want. We'll answer your questions and send a copy of our industry-best pricing model to review with your team.
We typically respond within one business day.